Reports
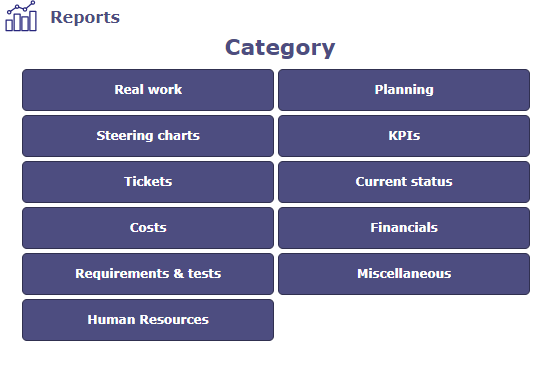
A list of reports is available in different categories. They themselves contain several sub-categories.
You will find the reports home page in the menu but also all the categories.
These, directly accessible, allow you to find the report of your choice from the main menu.
Reports View
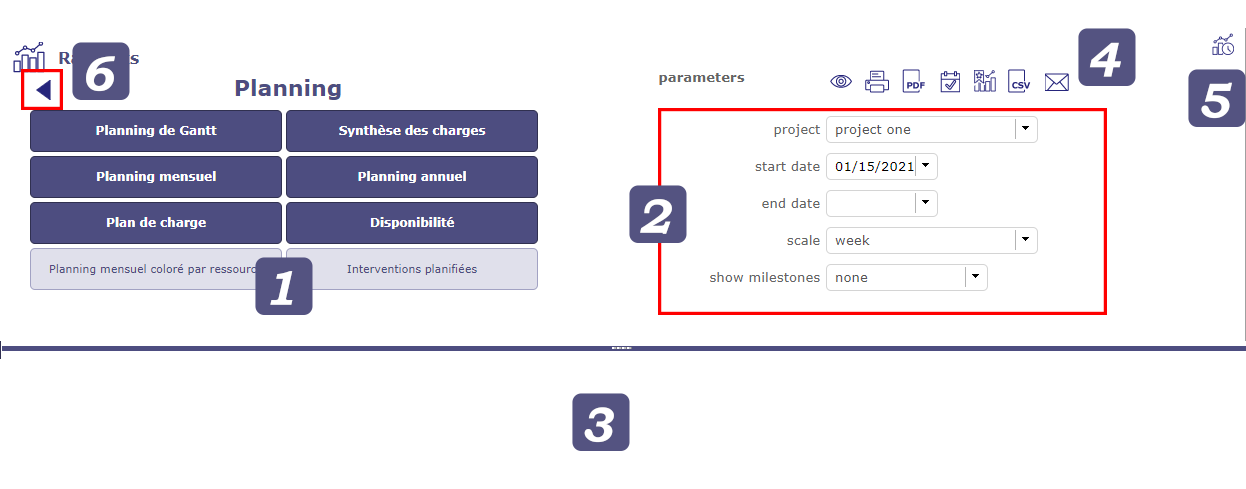
Select a category to view subcategories and select a report.
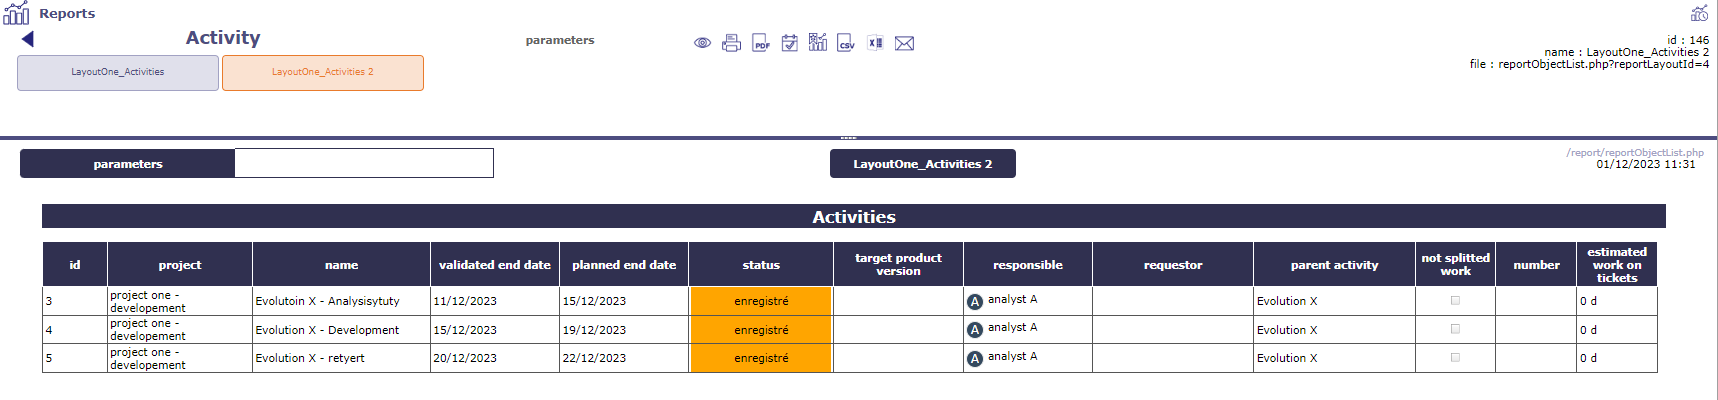
Parameters specific to this report are displayed. Update the settings to get the information you need.
Click on
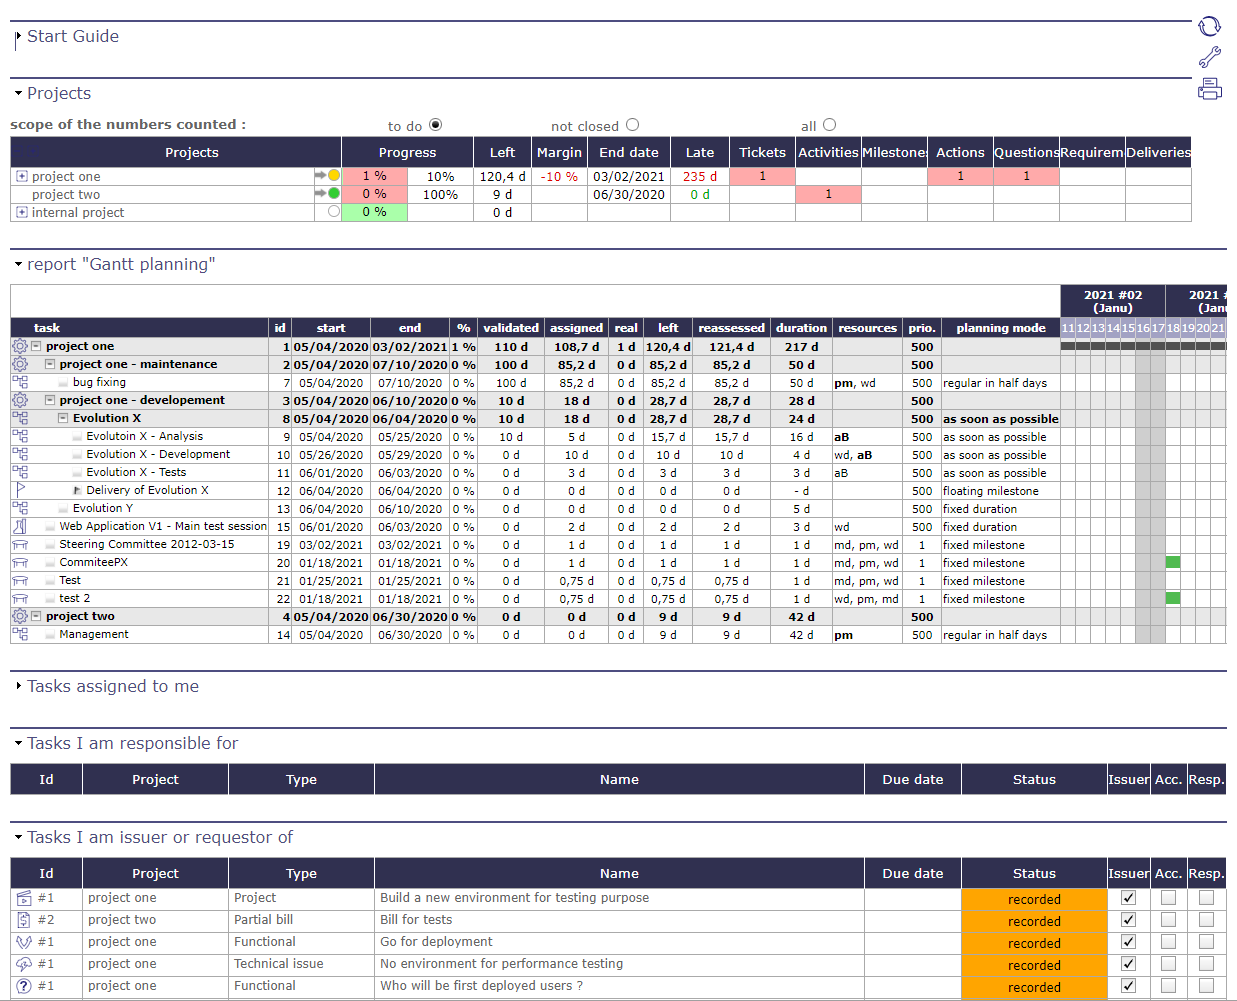
 to generate the report. The selected report will appear under the splitter.
Several tools are available to export and send your reports. See buttons.
You can access the scheduled reports screen from the reports screen.
Click on the arrow to return to the list of categories.
Note
Horizontal slider position is saved when changed manually.
Click on
to View the report.Click on
 to get a printable version of the report.
Click on
 to export the report as PDF format.
Click on
 to View this report on the Today screen.
Click on
 to define this report as favorite.
Click on
 to schedule sending the selected report
Click on
 to go to scheduled report screen
Today Screen Report
You can add reports to your home screen today.
Select the report you want to see quickly on this screen.
Click on the button
On the Today screen, the report is Viewed at the bottom of the page
Click on the setting icon on the screen today to change the location of the report
Note
The Viewed report is updated automatically. Any modification made to the content of the latter is reflected on the screen today.
The reports displayed on the today screen automatically adapt to your screen size as much as they can. If the display can no longer adapt, a horizontal scroll will allow you to read the entire report
View a report on the today screen
Click the parameter button to define the location of the report (s) on the Today screen.
Click on the handles to move the item in the list.
Favorite reports
Move your cursor over the reports menu icon (in the top bar) to show the popup menu that contains your favorite reports.
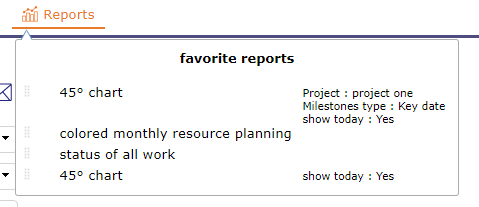
You can add a “blank” report type to the favorites or to a specific project and resources. In this case, next to the report name, linked items will be Viewed.
Popup menu management
Allows to reorder reports Viewed with drag & drop feature. Using the selector area button icon drag
 .
.Click on
 to remove the report from the list.
Filter Reports
For tickets and only tickets, you can apply an existing or create filter
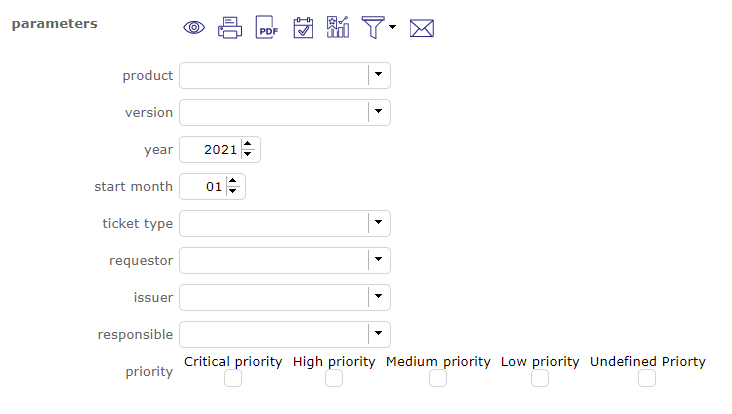
As with the advanced list box filters, you can choose from many criteria to create your filter;
See also
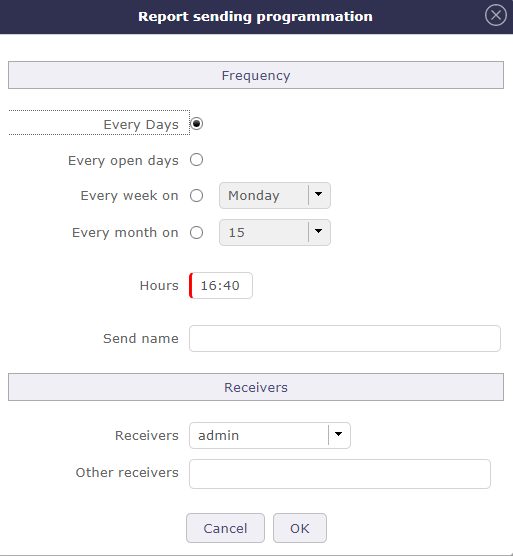
Report Sending programmation
Ability to schedule the sending of reports as emails
For example, you can send a report every day, every Monday or every first day of the month
Sending a report to email
To view all scheduled reports for sending, go to Scheduled Report in the Tools menu
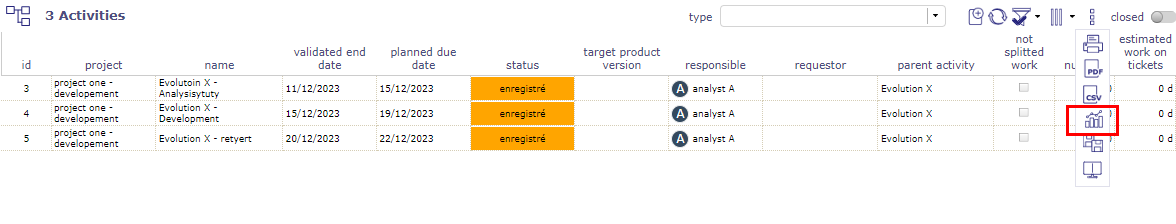
Reports from lists
When you are on a list of items, such as activities, tickets, actions or any other items… you can create reports from your list layout
On the list
The  “save object list as report” function is available in the list box tools.
List as report
You can edit the columns and place them in the order you want, you can apply simple or advanced filters.
When you click on a pop-up is open.
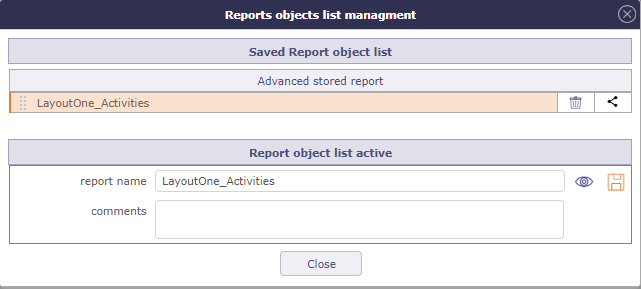
Windows to save the list as report
Name your list layout and save it by clicking  .
.
The list will be stored as you prepared it and you will find it in the reports.
On the reports
In the reports, you will find a new category where the different list reports that you have copied so far will be copied.
They are sorted by items, knowing that you can create several different reports for the same item.
Windows to save the list as report
You will then obtain the report as you programmed it from the element list.
Each of these reports can be added to the today screen, can be sent at a given frequency.
They can be printed and exported to PDF, CSV and Excel.
Windows to save the list as report
Complete list of reports
Real Work
Allows you to view the actual expenses consumed by your resources on one or all projects over a given period.
Most reports allow you to refine the display by organization, by team and by resource or even by type of activity.
reports that can be exported in excel format are indicated by the icon 
WORK
Work - Weekly
Work - Monthkly
Work - Yearly
Work - Between two dates
Work for a resource - Weekly
Work for a resource - Monthkly
Work for a resource - Yearly
Work for a resource - Between two dates
Monthly wor for resource
Work monthly detailed by resource
Work yearly per month
WORK DETAILED PER ACTIVITY
Detailed work per activity - Weekly
Detailed work per activity - Monthkly
Detailed work per activity - Yearly
Detailed work per activity - Between two dates
WORK DETAILED PER RESOURCE
Detailed work per resource - Weekly
Detailed work per resource - Monthkly
Detailed work per resource - Yearly
Detailed work per resource - Between two dates
WORK SYNTHESIS PER ACTIVITY
Work synthesis per activity
Work synthesis per activity between two dates
INDIVIDUAL CHARGES BY TYPE OF ACTIVITY
Work for a resource per type of activity - monthly
Work for a resource per type of activity - Yearly
Work for a resource per type of activity - Between two dates
OTHERS
Left work
List of work for an activity
Planning
The reports in the planning category allow you to track the use of your resources through your project schedules.
Diagram, synthesis, colored report, loads plan between planned and real work…
WORK SYNTHESIS
Work synthesis per activity
Work synthesis per activity - between two dates
Work synthesis per ticket
Synthesis of technical progress

Work synthesis per resource
MONTHLY PLANNING
Monthly planning resource/project
Monthly planning project/resource
Monthly planning project/activity/resource
Monthly planning resource/project/activity
Monthly planning for a resource
Monthly planning for a resource (per project)
YEARLY PLANNING
Yearly planning resource/project
Yearly planning project/resource
Global planning project/resource per month
Yearly planning project/activity/resource
WORK PLAN
Work plan per week
Work plan per month
Work plan per resource and per week
Work plan per resource and per month
Workload plan on given period
AVAILABILITY
Monthly availability of resources
Availability synthesis
Colored monthly resource planning
Colored monthly planning

Colored monthly planning fixed scale
OTHERS
Planned interventions
Steering charts
The management diagrams are very precise reports to follow, compare and inform on the costs, deadlines and progress of your projects.
Burndown chart
S curve chart
45° chart
Performance indicator
Proposales
RIDA (Statement of Information Decisions Actions)
Report project analysis
KPIs
Track your KPI indicators with precision.
KPI DURATION
KPI Duration for project
KPI Duration consolidated
KPI WORKLOAD
KPI Workload for project
KPI Workload consolidated
KPI INCOMING/DELIVERABLE
KPI Deliverable for project
KPI Deliverable consolidated
KPI Incoming for project
KPI Incoming consolidated
OTHERS
Client invoicing terms
Work Units synthesis
Workload history
Tickets
Find here all the reports concerning the follow-up of your tickets on one or more projects and this, over a given period.
You can restrict and filter your display by resource, by customer, by requestor, issuer or manager. But also by priority or qualification.
TICKET COUNT
Yearly report for tickets
Yearly report for tickets by type
Report for tickets cumulated - number of days
Yearly report for tickets by product
REPORT FOR TICKETS BY QUALIFYING
Report for tickets by qualifying - weekly
Report for tickets by qualifying - monthly
Report for tickets by qualifying - yearly
Report for tickets by qualifying - global
REPORT REPARTITION
Report for opened tickets - weekly
Report for opened tickets - monthly
Report for opened tickets - yearly
Report for opened tickets - global
TICKET SYNTHESIS BY STATUS
Handled ticket synthesis - monthly
Done ticket synthesis - monthly
OTHERS
Curve of tickets BurnDown
Clients impacted by tickets
Current status
The current status category allows you to follow the status of elements relating to the project: Activities, activity tasks, risks, Document approval …
RISK AND ACTIONS
Risk management plan
Actions table
OTHERS
Status of ongoing work
Status of all work
Opportunity plan
Version detail
Jobs summary for activities
Approval of documents
Costs
You will be able to follow all your costs related to the project, the activity or your resources.
EXPENSES
Project expense per month
Individual expense per month
Total expense per month
OTHERS
Cost synthesis per activity
Resources costs per month
Detailed resource costs per activity per month
Total expense and cost per month
Financials
In the same way, you will be able to follow the receipts related to the project and their consolidation.
CLIENT INVOICING TERM
Monthly terms
Weekly terms
OTHERS
Invoices
Financial expenses board
Financial expenses synthesis
Monthly consolidation
Summary of orders / client invoicing
Summary of work command / acceptance
Requirements & Tests
You will be able to trace the status of cases played out for requirements and / or products, monitor requirements coverage, review annotations, comments and obtain various summaries.
TEST COVERAGE
requirements test coverage
products test coverage
test cases detail
test session summary
REQUIREMENT FLOW
Requirements flow annual
Requirements cumulated on number of days
Requirement yearly by type
REQUIREMENT OPENED
Requirement weekly opened
Requirement monthly opened
Requirement yearly opened
Requirement global opened
OTHERS
Curve of requirement Burn-Down
Requirements with open questions
Miscellaneous
A set of additional but very comprehensive reports on your projects and some of its elements.
HISTORY
Detail of history for one item
Deleted items
OTHERS
Connections audit
Project dashboard
Followed items
List of attachments per user
Human Resources
A set of additional but very comprehensive reports on your projects and some of its elements.
Resources inputs - outputs
Resources workforce
Resources seniority