Project planning is of paramount importance to ensure the success of your objective and allows you to estimate the necessary resources, establish a schedule and define the expected performance indicators.
Projeqtor offers a wide choice of control levers to best plan your project and in precise conditions.
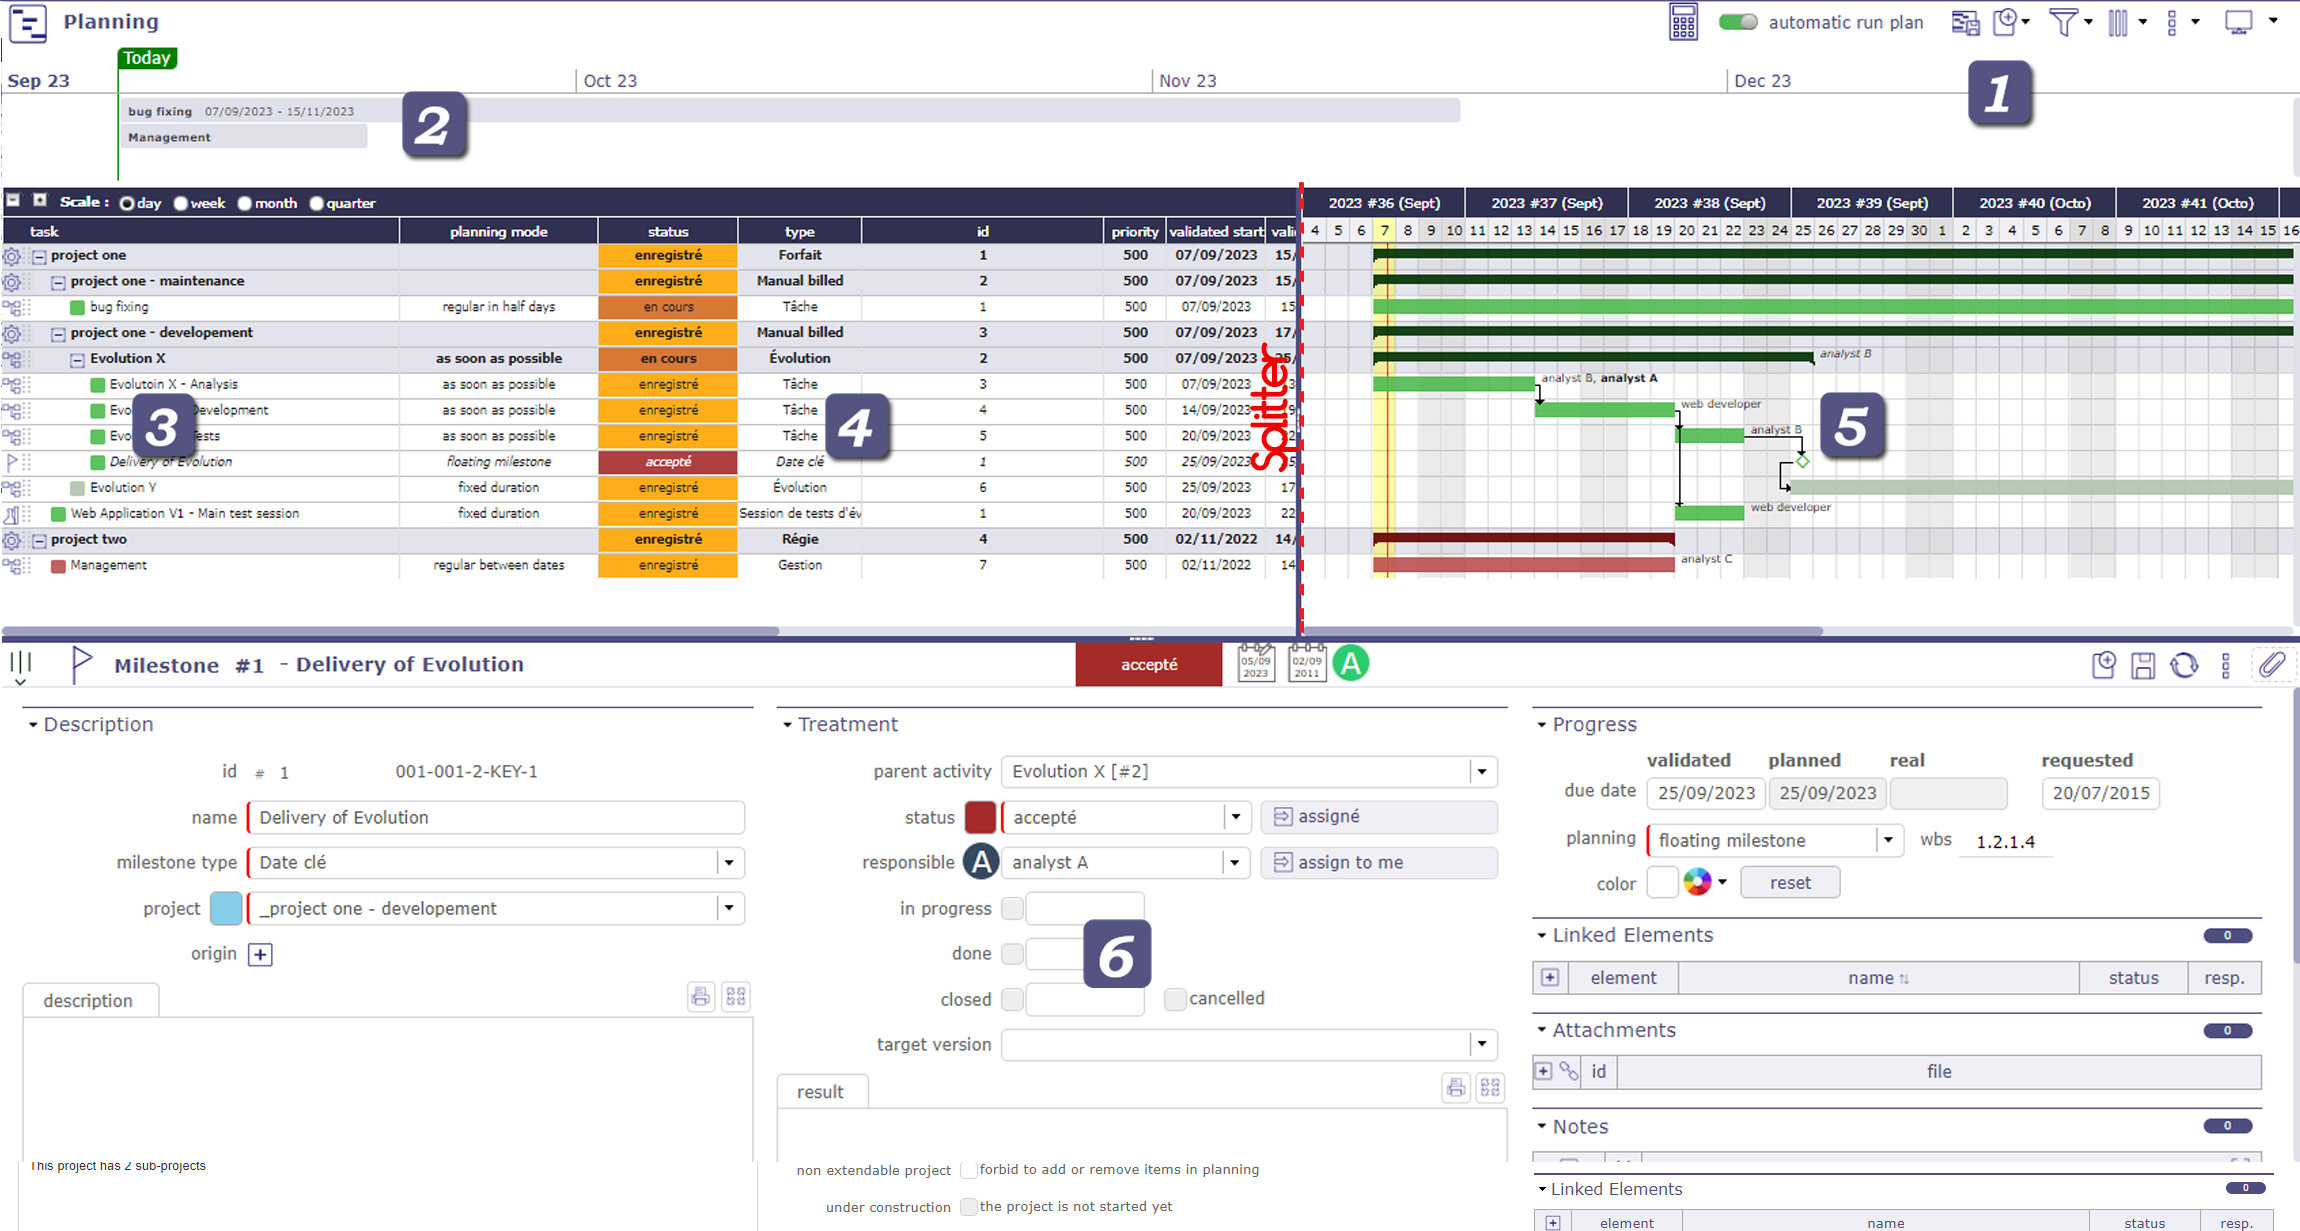
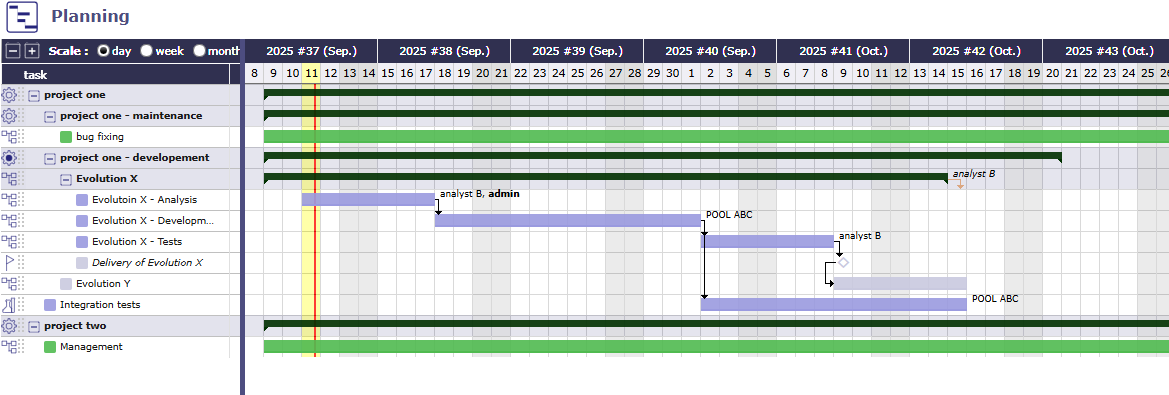
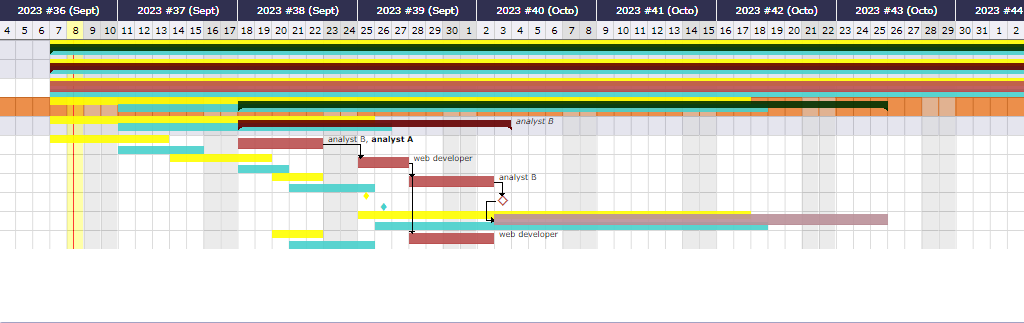
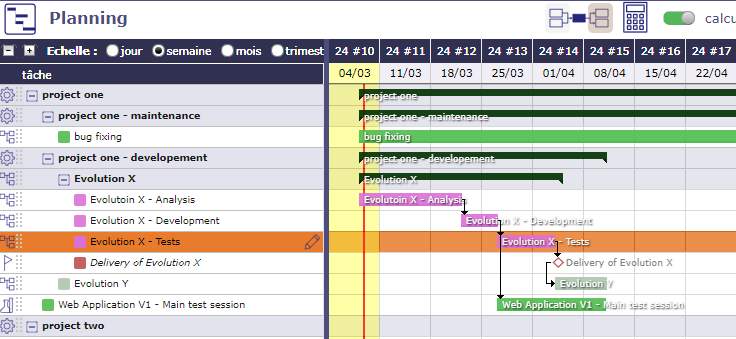
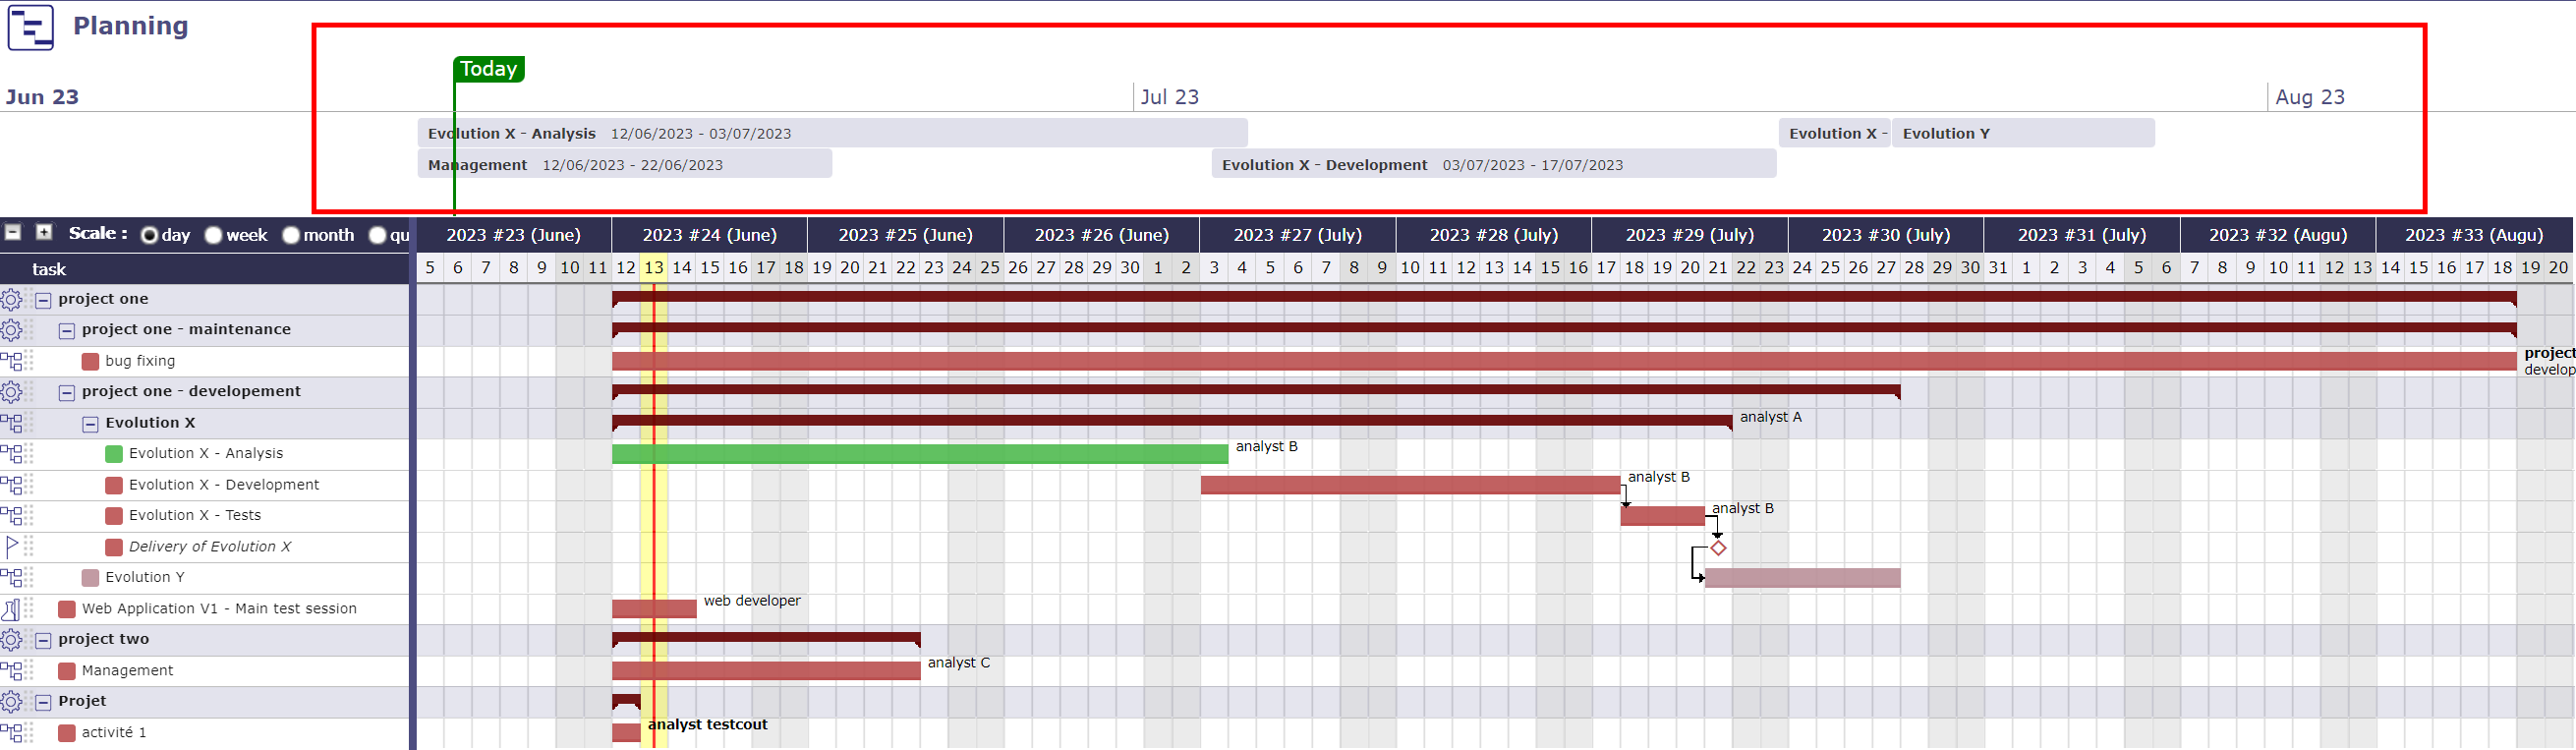
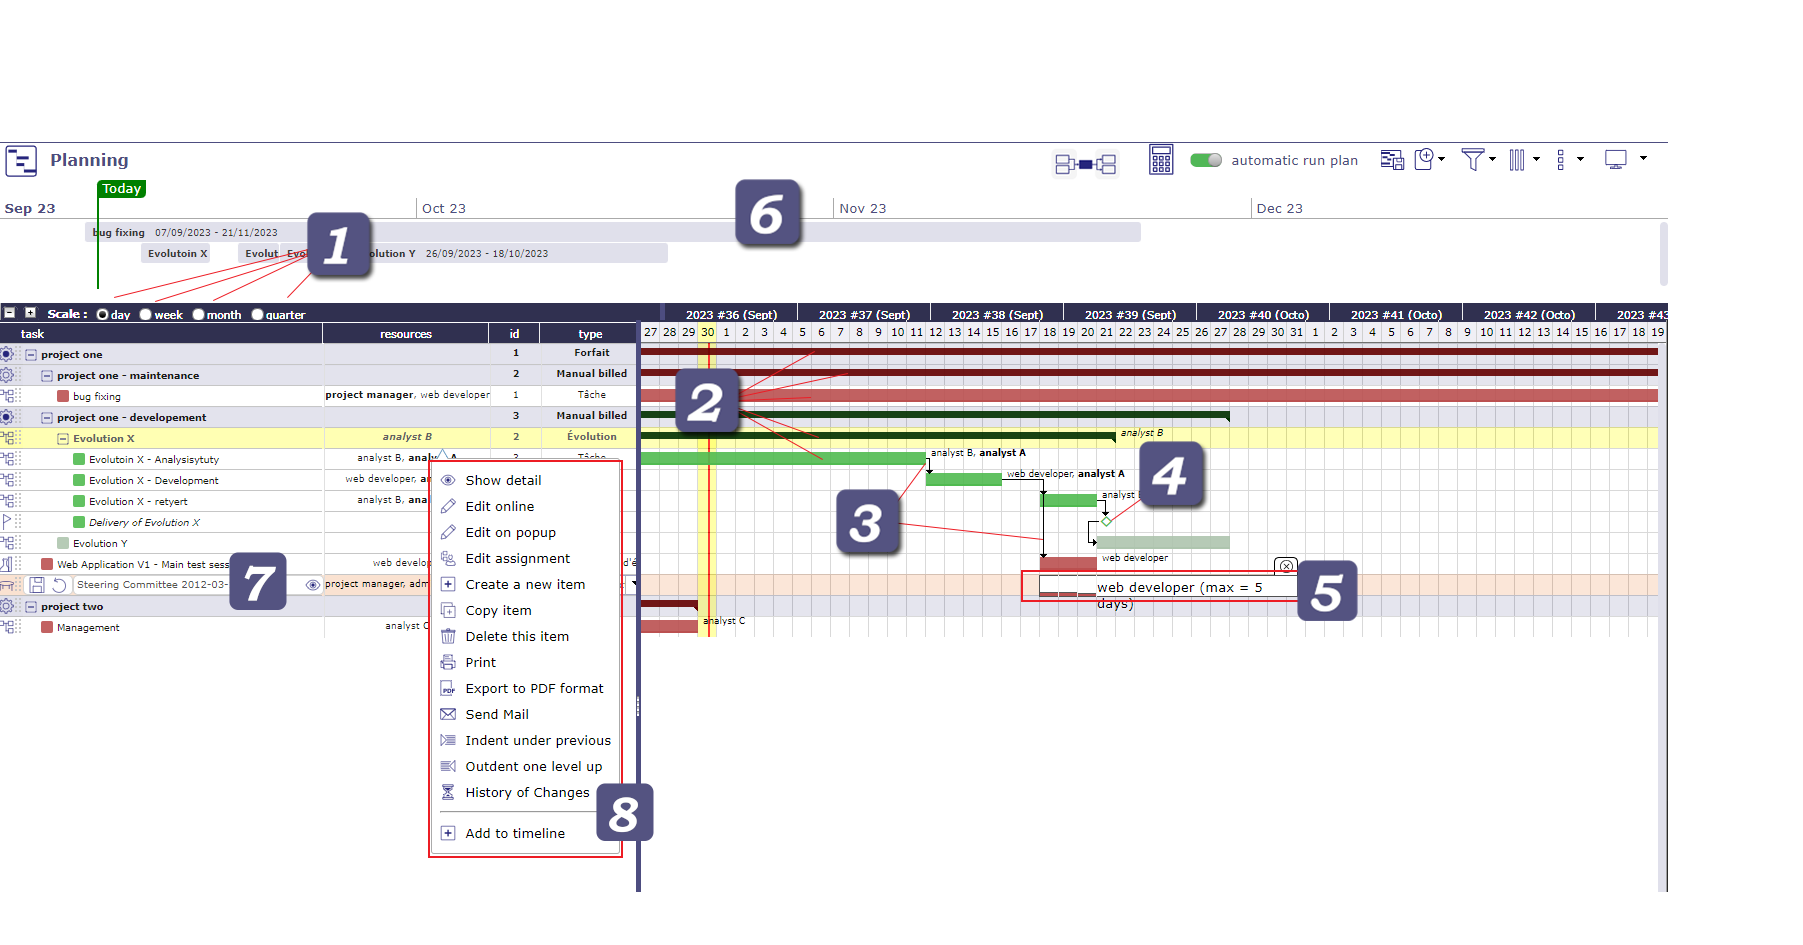
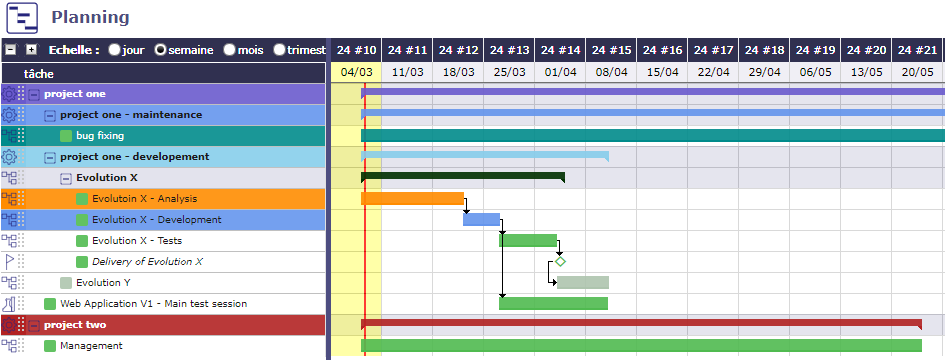
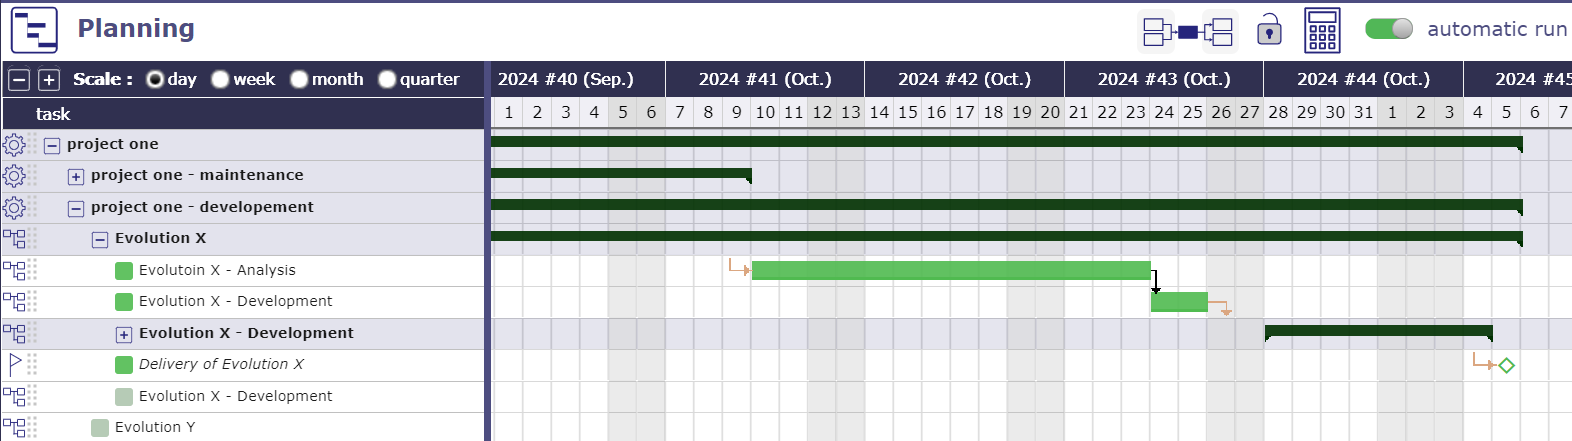
The Gantt chart is a tool used in planning and project management to visualize the different tasks that make up a project over time.
Note
For large projects, with many sub-projects and activities, the number of lines to be displayed is limited in order not to deteriorate performance, even if the project selector has already contextualized the display.
When you make a modification on an element of your project, the project must then be recalculated to take it into account.
You have the option of using the automatic calculation function, which, if you make a modification on the planning screen, and only on this screen, will immediately take this modification into account.
If the modification is made on another screen, even if you have selected automatic calculation then, you will have to restart the calculation on the planning screen.
Click on to start the activity planning calculation.
A popup window appears with the list of projects.
The check boxes in the list area allow you to select one or more projects to recalculate.
If you have selected one or more projects with Project Selector then the selected projects will be automatically checked.
Choose the date on which you want to recalculate the project.
By checking the “Hide unselected projects” box, you will only have the projects selected in the project selector and they will be automatically checked.
Important
When the schedule calculation takes a long time, with thousands of activities to be scheduled, the existing scheduled work is deleted, then the calculation is performed, and then the new scheduled work is saved.
During the calculation, users who right-click on the activity do not see the data (the scheduled work is deleted).
The idea is to delay the deletion of the scheduled work as long as possible, until just before new values are created.
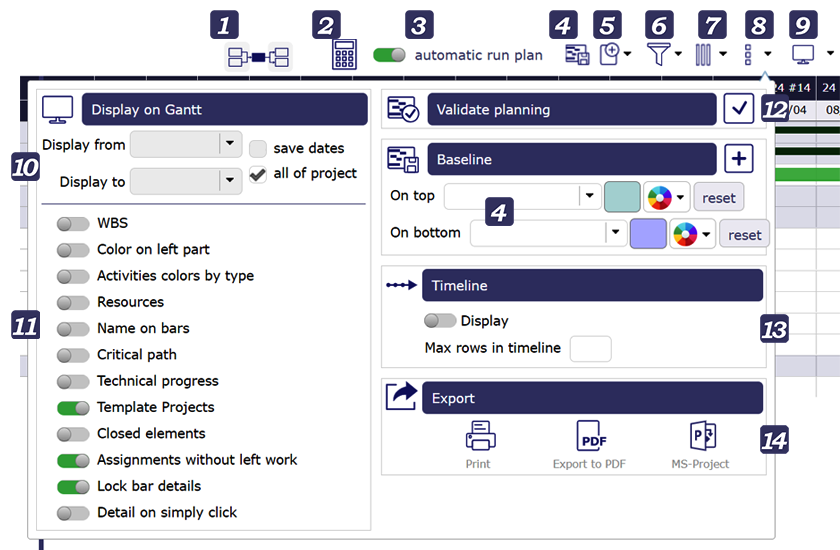
Swith the button to activate automatic calculation on each change.
Only works on the Gantt Planning view.
If the modification of an element is carried out on the dedicated screen of the element, then it is necessary to click again on BUTTON to restart the computation
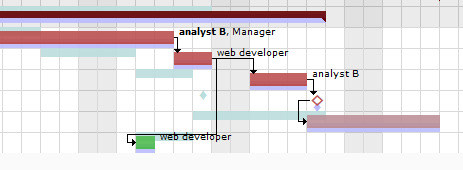
All modifications about assignement (rate, name or numbers of resources, dates…) done are not displayed on the new planning screen until having, for this purpose, activited the planning calculation, either in an automatic run plan or not.
On the contrary, the screen planning will not change even if modifications have been loaded yet.
Automatic calculation
Differential calculation = calculation of projects requiring recalculation after being modified.
Complete calculation = calculation of all projects
The calculations are programmed according to a frequency of CRON type (every minute, every hour, at a given hour every day, at a given time on a given week day, …)
The objective is to be able to perform a quick schedule calculation when the automatic schedule calculation function is deactivated in order to obtain an initial result directly on the modified tasks without having to recalculate the capacity
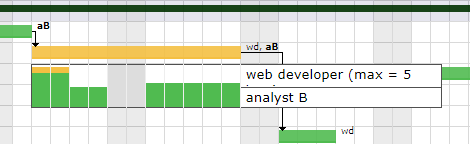
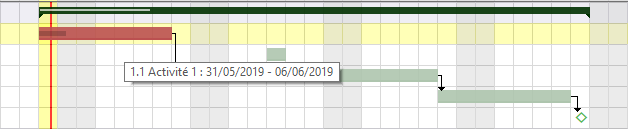
The detail of the bars is visible with a right click directly on the bars.
By default, this detail showing the dispatch of the planned work for the resources, does not remain displayed when you no longer hover over the bar after the right click.
Activate this option so that the detail remains displayed
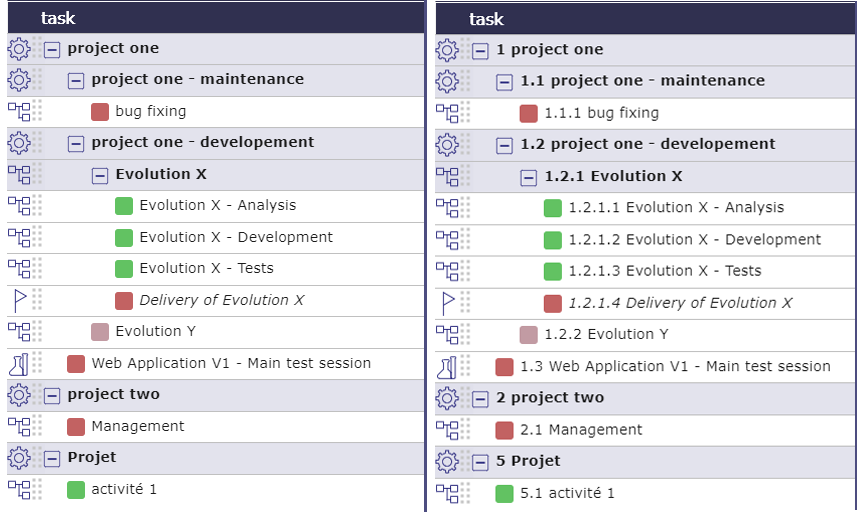
When you click on an item in the list box (WBS) and this item is not displayed/visible directly on the Gantt chart then an auto scroll is executed to this item to visualize it on the chart.
This feature will execute export on client side, in your browser. Thus the server will not be heavy loaded like standard PDF export does.
It is highly faster than standard PDF export.
Warning
This technically complex feature is highly dependent on the browser and is not compatible with all of them.
It is compatible with the latest versions of IE (v11), Firefox, Edge and Chrome. Otherwise, the old export function will be used.
Tip
Forced feature activation/deactivation
To enable this feature for all browsers, add the parameter $pdfPlanningBeta=’true’; in parameters.php file.
To disable if for all browsers, add the parameter $pdfPlanningBeta=’false’;
Default (when $pdfPlanningBeta parameter is not set) is enabled with Chrome, disabled with other browsers
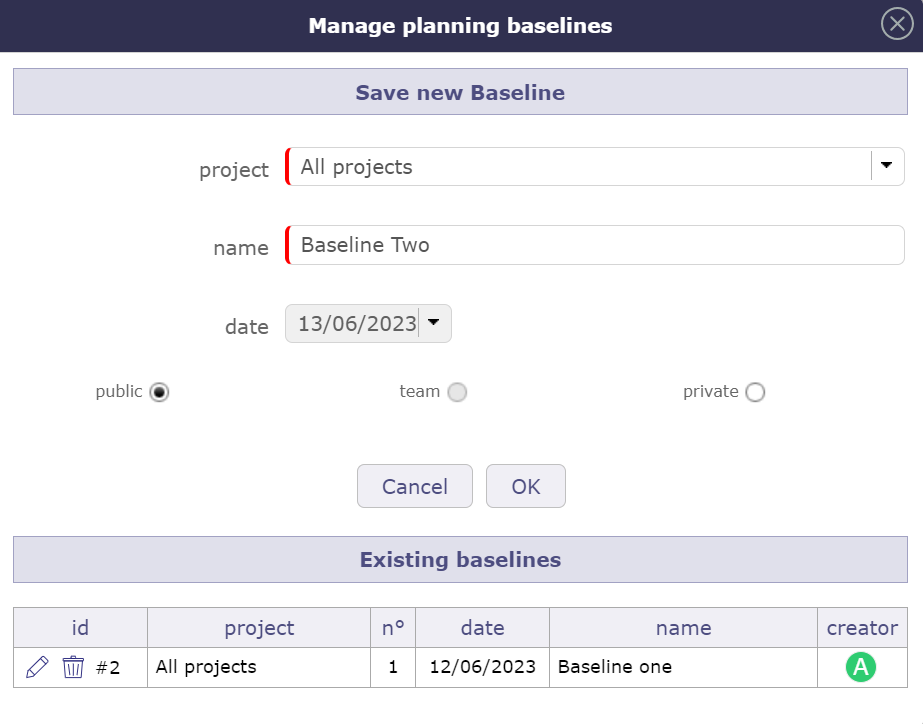
When you perform a calculation on the schedule, you can consult its dedicated history.
In parallel with the history of the elements, you can find the names of the projects that you have recalculated, the duration of the calculation and whether it was completed successfully.
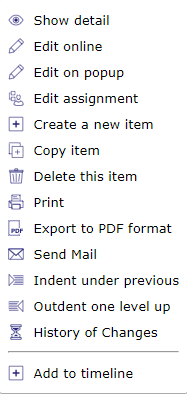
By right clicking on each of the lines you have access to the Gantt submenu which allows you to access certain actions by going through the main menu of the screen.
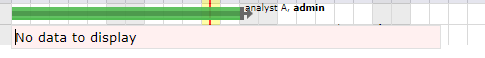
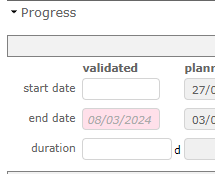
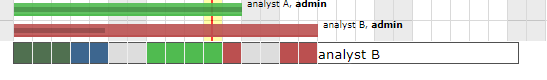
The progress data view allows you to visualize the progress of all the elements of one or more projects with their consolidation. Each line corresponds to an element.
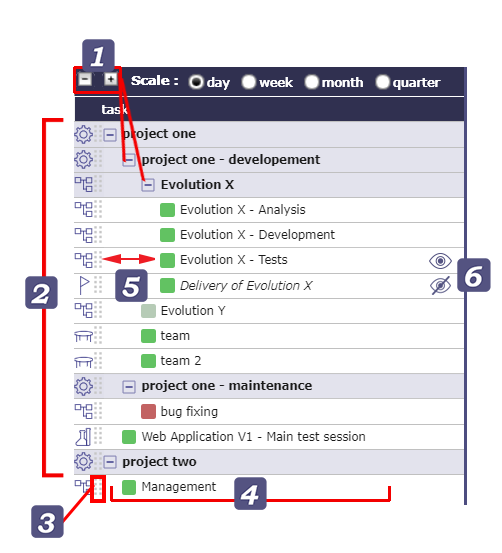
To display this information, drag the splitter between the list box and the Gantt chart.
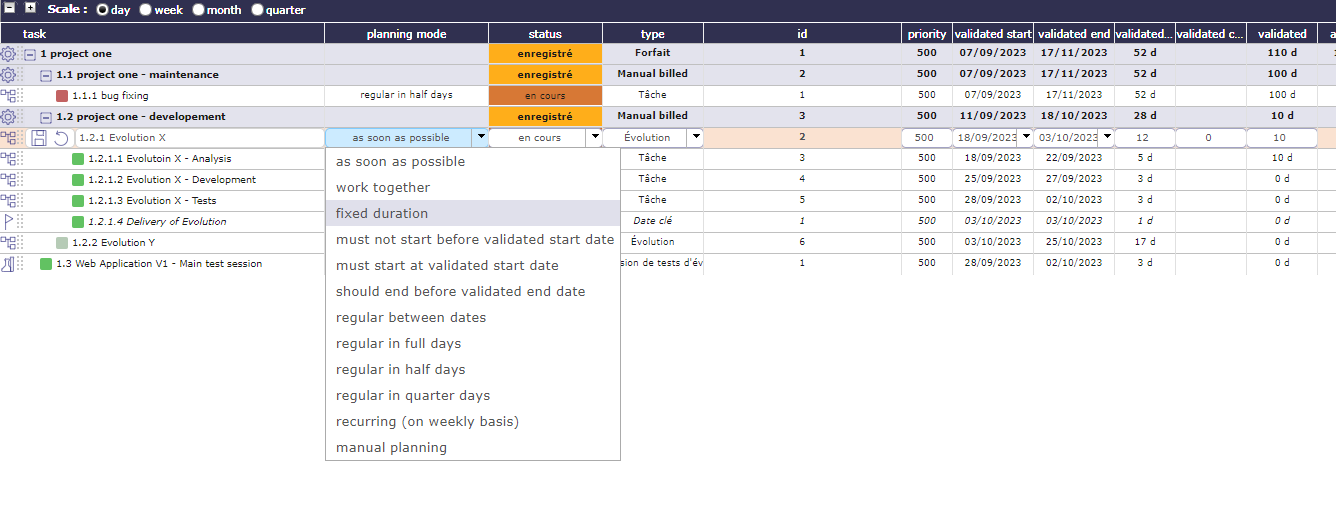
Scale available: daily, weekly, monthly and quarter.
The Gantt chart view will be adjusted according to scale selected.
When you are in the planning view on the wbs and gantt area and details area, you can move from one scale to another using the wheel control on your mouse.
Mouse wheel up to increase the scale*.
Mouse wheel down to decrease the scale.
When you continue to increase after the semester, then we loop and return to the day scale, the smallest.
Outside of these areas, the mouse wheel will increase the zoom of your browser.
Condition: Fast calculation - no calculations between projects were carried out - graphical representation - without load - modifications to the task without taking into account the steering levers - Planned end date < or = Validated end date
Condition: Fast calculation - no calculations between projects were carried out - graphical representation - with load - modifications to the task without taking into account the steering levers - Planned end date < or = Validated end date
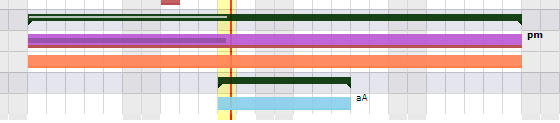
Pale red bar
no charge and date planned is superior to validated date
Condition: Activities without assigned work - Planned end date > Validated end date
Condition: If a resource is not or is no longer available on an activity.
The calculator is trying to plan the workload.
The resource assigned to the activity is unable to be planned for this task (absence, calendar, assignment or assignment periods, etc.); then the bar turns purple.
Pink bar
Thanks to the setting on the management of inherited dates, you will be able to display the pink color to indicate that the end date of this task was recovered from a successor element.
Condition: The capacity of the resource has been changed. It can be under capacity or over capacity. That is to say, it does less or more than its FTE.
Condition: the length represents the percentage of completion of the units of work that you enter manually (Delivered - completed) in relation to the length of the Gantt bar.
You can display both progress bars at the same time on the Gantt chart bar.
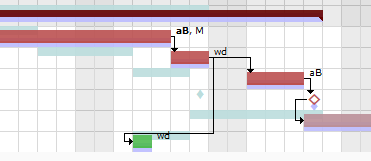
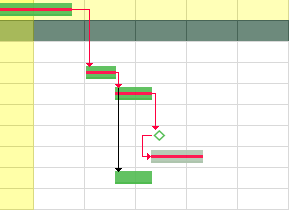
Dependencies allow to define the execution order of tasks (sequential or concurrent).
All planning elements can be linked to others.
Dependencies can be managed in the Gantt chart and in screen of planning element.
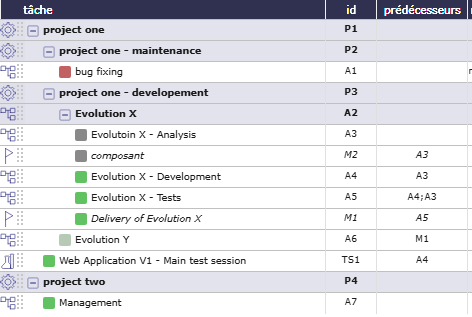
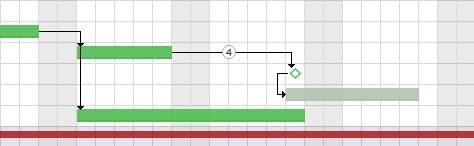
Dependencies between planning elements are displayed with an arrow.
Important
Strict mode for dependencies
The strict dependency mode forces the successor planning element not to start on the same day as the same predecessor but the next day. Even if the task is finished before the end of the day.
To have the successor start on the same day or before the end of the predecessor task, select NO for strict mode or you can also put a negative delay.
The strict dependency mode is a global parameter. By default, the strict dependency mode is set to YES.
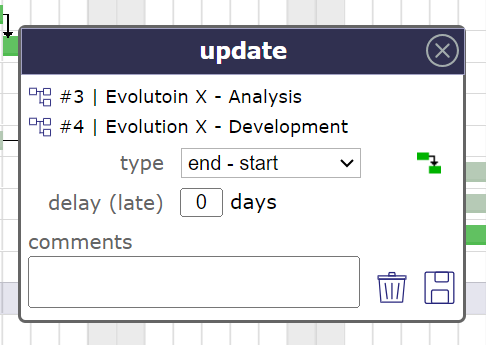
ProjeQtOr offers three types of dependency. The fourth type start-End is not represented.
End-Start
The second activity can not start before the end of the first activity.
Start-Start
The successor can not begin before the beginning of the predecessor. Anyway, the successor can begin after the beginning of the predecessor.
End-End
The successor should not end after the end of the predecessor, which leads to planning “as late as possible”.
Anyway, the successor can end before the predecessor. Note that the successor “should” not end after the end of predecessor, but in some cases this will not be respected:
if the resource is already 100% used until the end of the successor
if the successor has another predecessor of type “End-Start” or “Start-Start” and the remaining time is not enough to complete the task
if the delay from the planning start date does not allow to complete the task
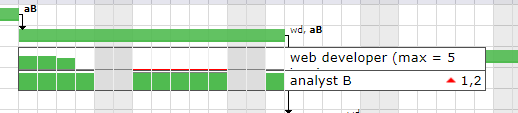
When dependencies are hidden, project folded or parent activity folded on the planning view for example, then a pale orange arrow is displayed in front of the selected element
It means that this element has a constraint that is not currently displayed on the planning view.
 to display the first level of predecessors of the selected element
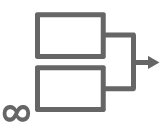 to display all predecessors of the selected element
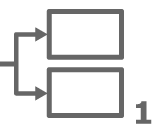 to display the first level of successors of the selected element
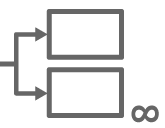 to display all successors of the selected element.
 to clear the selection of the predecessor or successor
 to start the activity planning calculation.
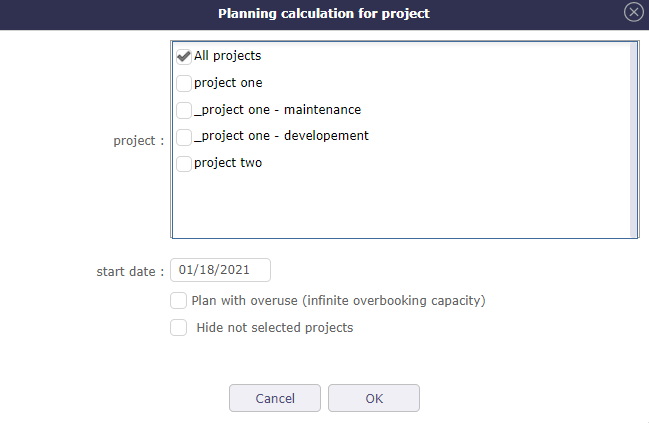
 .
.
appears at the end of the line. Click on it to see the details.
to close the detail
 to print the Gantt chart in A4 and / or A3 format.
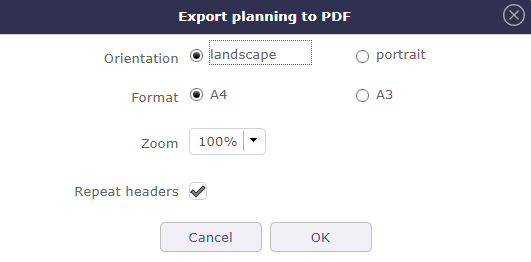
 to start the export.
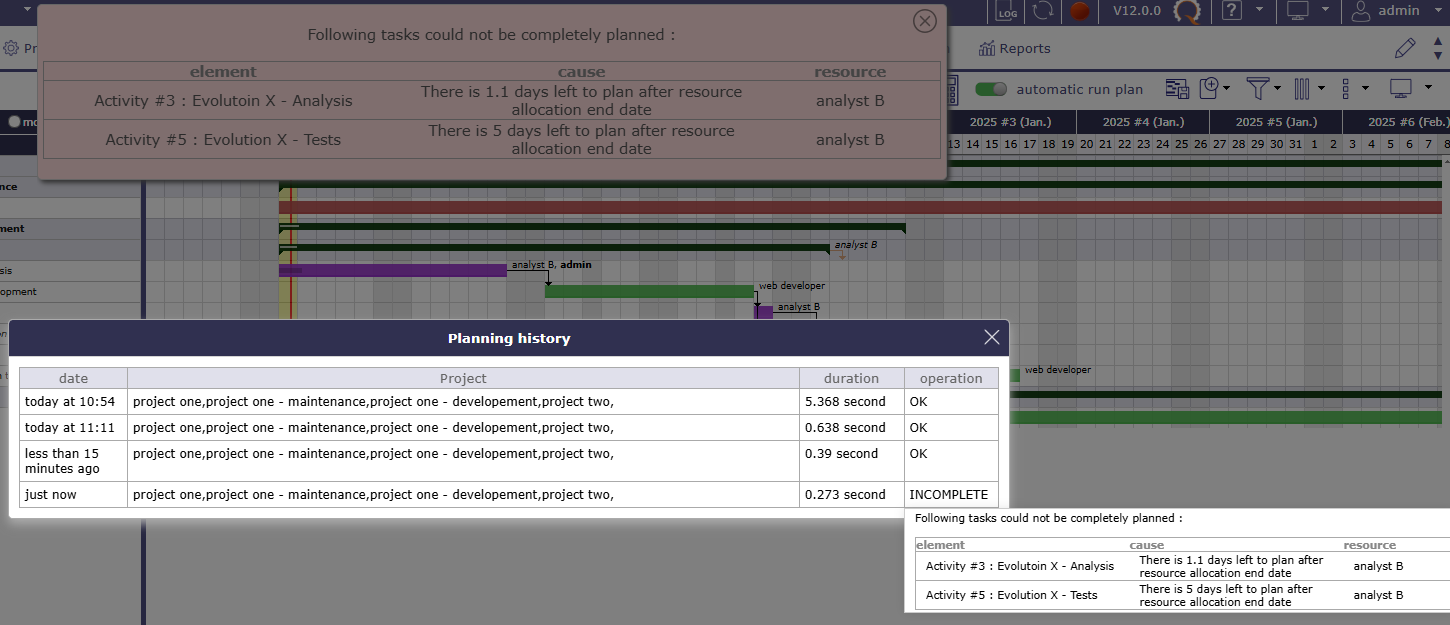
 Project
 Project to recalculate (the Gant diagramm to display with the latest settings)
 Project under construction
 Projet fixed in the planning
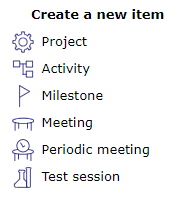
 Activity
 Milestone
 Meeting
 Test session
 allows to reorder the planning elements.
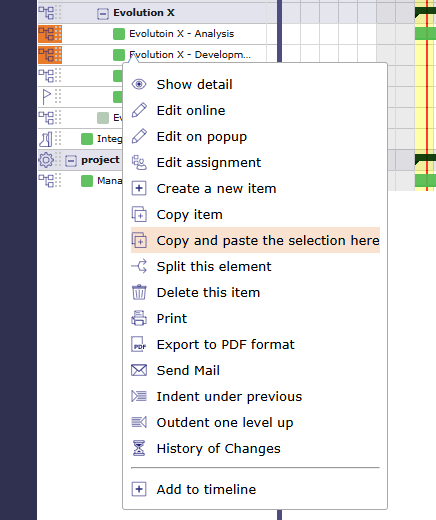
 to recorded the modification
 to cancel the modification
 to edit the line
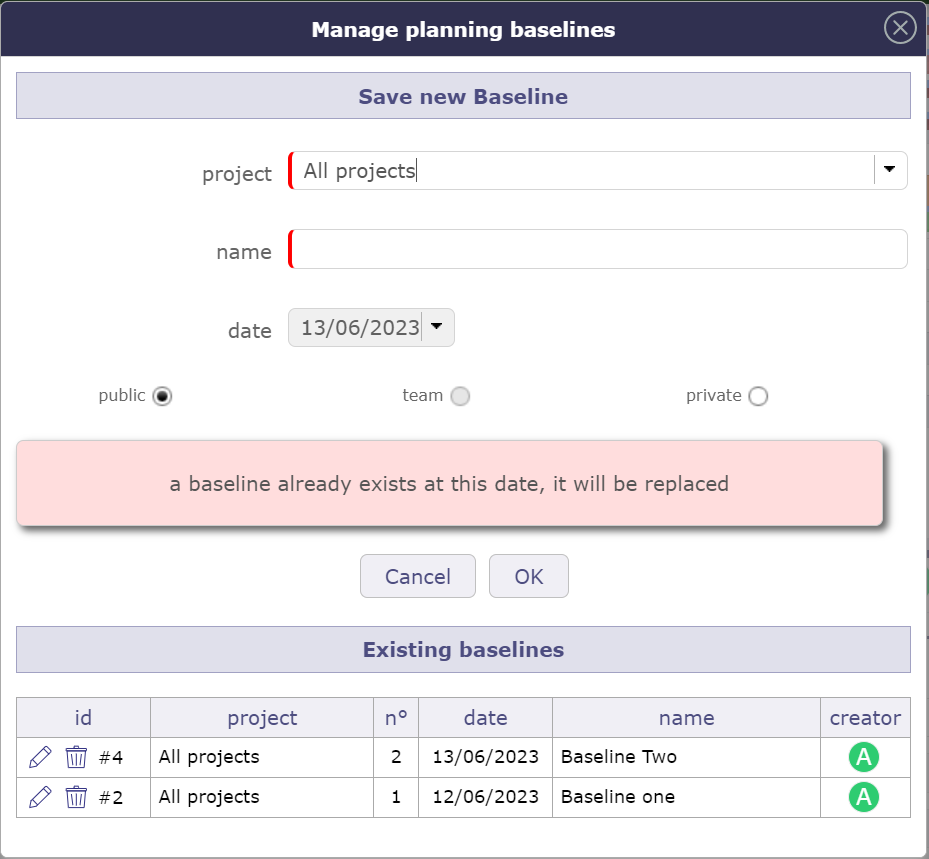
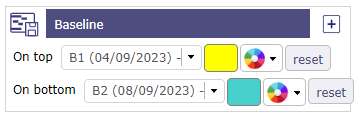
 to manage them.


 on the corresponding section to add a dependency link.
 to delete the corresponding dependency link.
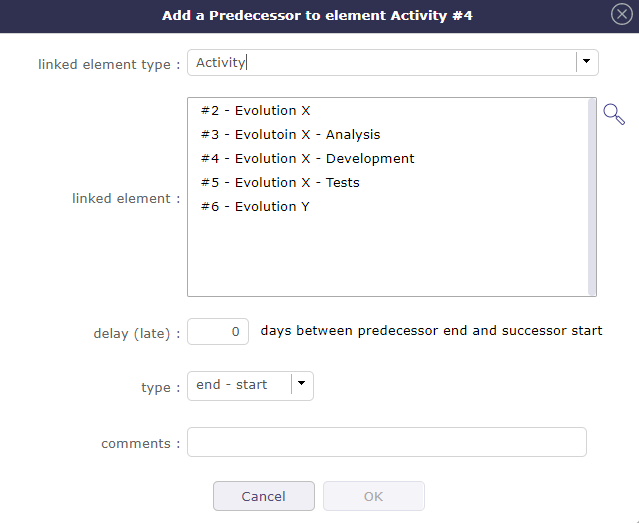
End-Start
Start-Start
End-End


 Planned workload
 Real work - charged to the timesheet
 Excess workload over dates
 Real work with Excess workload over dates
 Absence of the resource